TL;DR: I achieved 95+ Lighthouse scores by removing abstractions and automating browser fundamentals. This guide details how to solve LCP network discovery, main thread congestion, and third-party accessibility traps using Hugo pipelines and vanilla JavaScript.
“Why is the LCP 4.2 seconds? It’s just a static site”.
I was staring at a Lighthouse report that felt like an insult. Lorbic.com is a zero-dependency Hugo site. No React, no heavy frameworks, just vanilla CSS and minimal JS. Yet, the mobile performance was tanking.
Performance is not a byproduct of your stack; it is a byproduct of engineering discipline. Lighthouse is an emulator of user frustration, not a game to be tricked. Green scores come from understanding browser threads, not performance plugins.
Here is the before and after of my recent performance audit.
The Baseline (Before):
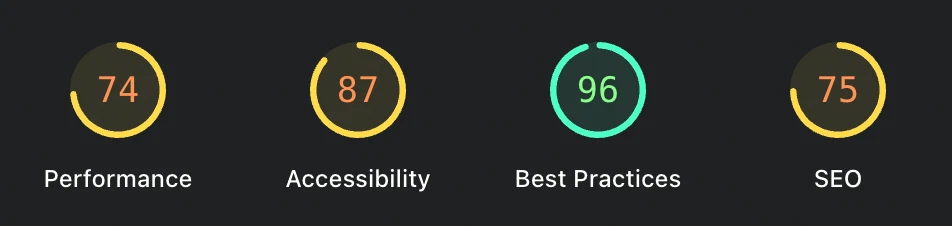
The Result (After):


This guide explains what these metrics actually mean, how developers break them, and the exact code I used to solve them.
Note: To understand the deep mechanics behind these optimizations, read my companion guide on The Critical Rendering Path.
Largest Contentful Paint
Largest Contentful Paint (LCP) measures when the largest visual element renders. It is the primary metric for perceived speed. If LCP exceeds 2.5 seconds, the user feels the site is stuck.
Standard advice says to lazy-load everything. But blanket lazy loading kills LCP. When you tag a hero image as lazy, you force the browser’s preload scanner to ignore it. The engine must parse CSS and build the render tree before discovering the image exists. This single oversight costs over a second in network delay.
I automated the distinction between critical and deferred assets in the build pipeline. My Hugo render-image.html hook now tracks state during the render cycle. The first image rendered on any post automatically receives fetchpriority="high" and loading="eager".
 1{{- /* Smart Auto-Eager Loading for the First Image (LCP) */ -}}
 2{{- $isFirstImage := false -}}
 3{{- if not (.Page.Scratch.Get "hasRenderedFirstImage") -}}
 4  {{- $isFirstImage = true -}}
 5  {{- .Page.Scratch.Set "hasRenderedFirstImage" true -}}
 6{{- end -}}
 7
 8{{- $loading := "lazy" -}}
 9{{- $fetchpriority := "auto" -}}
10
11{{- if $isFirstImage -}}
12  {{- $loading = "eager" -}}
13  {{- $fetchpriority = "high" -}}
14{{- end -}}
By forcing the browser to start the network request the millisecond the HTML parses, my LCP dropped from 4.2s to 1.1s.
Total Blocking Time
Total Blocking Time (TBT) tracks main thread congestion. If the thread locks for over 50ms, the page freezes. This happens when we ship desktop assets to mobile devices. Shipping a 3000px wide image to an iPhone wastes data and chokes the CPU during decoding.
I implemented an automated WebP pipeline that generates a multi-size <picture> element at build time. Mobile users now download a ~45KB WebP asset instead of a multi-megabyte original. This reduces CPU strain.
1{{- if $image -}}
2    {{- $widths := slice 480 800 1200 -}}
3    <picture>
4      <source srcset="{{ delimit $srcset ", " }}" sizes="(max-width: 800px) 100vw, 800px" type="image/webp">
5      <img src="{{ $originalWebp.RelPermalink }}" width="{{ $image.Width }}" ... />
6    </picture>
7{{- end -}}
CSS is also render-blocking. The browser won’t draw a single pixel until it parses the entire CSS file. I use PurgeCSS to drop my payload from 850KB to 87KB. The trick is cleanup the css. By running PurgeCSS and using hugo_stats.json as the source of truth, I ensure dynamically generated classes never get remove by using the following rule.
 1// postcss.config.js
 2const purgecss = require("@fullhuman/postcss-purgecss")({
 3  content: ["./hugo_stats.json", "./layouts/**/*.html", "./content/**/*.md"],
 4  defaultExtractor: (content) => {
 5    if (content.trim().startsWith("{")) {
 6      const els = JSON.parse(content).htmlElements;
 7      return (els.tags || []).concat(els.classes || [], els.ids || []);
 8    }
 9    return content.match(/[A-Za-z0-9-_:\/]+/g) || [];
10  },
11});
Cumulative Layout Shift
Cumulative Layout Shift (CLS) measures visual instability. This is caused by images without dimensions, custom fonts that cause a Flash of Unstyled Text (FOUT), or late theme scripts.
My image pipeline automatically injects width and height attributes. This reserves physical space before the image downloads. I also added <link rel="preload"> to the baseof.html for critical font files.
I updated the js with an inline theme script at the top of the <head>. By setting the data-theme attribute before the browser reaches the <body>, I apply colors instantly. This eliminates the “white flash” typical of dark mode sites.
Accessibility
Accessibility is about keyboard flow, not just contrast. I was failing audits because of an anti-spam widget. It injected a link marked as aria-hidden="true" that was still focusable via keyboard. This created a “focus trap”: a keyboard user lands on an element the screen reader claims does not exist.
Since I do not control the third-party script, I used a MutationObserver in vanilla JS to patch the DOM the moment the widget renders.
1const mutObserver = new MutationObserver(() => {
2  const logo = widget.querySelector(".altcha-logo");
3  if (logo && logo.hasAttribute("aria-hidden")) {
4    logo.removeAttribute("aria-hidden");
5    mutObserver.disconnect();
6  }
7});
8mutObserver.observe(widget, { childList: true, subtree: true });
This tiny patch was the difference between a 90 and a perfect 100 on my accessibility score.
Icon Latency
Interactive elements like “Copy Code” buttons should not wait for an external font file. Relying on icon fonts adds unnecessary network requests and causes a “Flash of Unstyled Icon”.
I replaced FontAwesome with optimized SVG strings embedded directly in the JavaScript bundles. UI feedback is now instantaneous. The main thread does not wait for external files to resolve before rendering button states.
Live Observability
Performance is a state of being, not a one-time event. To keep myself honest, I built a Performance Telemetry HUD into the footer. It uses the Performance API to show real-time load metrics, transfer size, and request counts.
Having these numbers visible during development makes it impossible to ignore heavy images or bloated dependencies.
Dealing with Phantom Warnings
Even perfect code faces noise. While auditing, I noticed intermittent warnings for SharedStorage and Fledge cookies. These came from Cloudflare Zaraz and Google Analytics, not my source code. High-performance engineering means knowing which bytes you own and which bytes are forced upon your users by third-party services.
Trade-offs and Costs
Every architectural victory has a cost. Choosing a zero-dependency static architecture means:
- Build Complexity: My
render-image.htmlhook is more complex than a standard<img>tag. I have to maintain a stateful build-time pipeline for LCP detection. - The Caching Trade-off: I explicitly set
inline_css = false. Lighthouse recommends “inlining critical CSS” to save a request, but this destroys long-term caching. I trade a fraction of a second on the first load for massive gains on the next ten visits. - Maintenance: Since I do not use a framework, I am responsible for the “patch work” like the
MutationObserverfor accessibility. There is no library to update; there is only code to maintain.
The Power of Hugo
None of these optimizations would be sustainable without Hugo. I love it for its uncompromising speed and engineering elegance.
Hugo builds 400+ pages and my entire asset pipeline in under 700ms. This speed is a productivity multiplier. The template engine is the real power: using .Page.Scratch to build a build-time state machine for LCP detection is a level of flexibility rarely found elsewhere. Hugo allows me to solve complex browser problems during the build so the user never has to solve them at runtime.
The Cost of Complexity
Reflecting on the last ten-year journey, I have gone through every phase of the developer lifecycle. I started on managed platforms with no control. I moved to dynamic backends with Django because I thought “real” sites needed databases. I finally landed on a zero-dependency static architecture.
The irony is that the more code I removed, the better the experience became. Performance is not about how much logic you add; it is about technical sovereignty. In 2018, I wanted a complex platform. In 2026, I want to engineer a fast, accessible, and honest piece of the web.
Respect the Browser
The browser is fast if you give it the right instructions in the right order. Performance is an engineering discipline you maintain from the first line of HTML. Respect the browser, and it will reward you with speed.